
In the data-driven economy, dashboards have become the default tools for business intelligence (BI). Platforms like Tableau and Power BI have played a significant role in helping organizations visualize and interact with their data.
However, as business operations become more complex and stakeholder expectations more nuanced, a new need has emerged - the Multi-Versatile Dashboard.
This is more than just a dashboard. It's a customized intelligence environment that adapts to the unique needs of top management executives, decision-makers, and data analysts — all within a single, integrated solution.
One Dashboard, Multiple Audiences
Traditional BI dashboards typically cater to a single user profile. They are either too high-level for analysts or too technical for executives. Here's how the needs vary across stakeholder groups:
- Top Management Executives seek quick, visual summaries — high-level KPIs, trends, and alerts — enabling strategic oversight in seconds.
- Main Decision Makers (such as function heads or business unit leaders) need mid-level analytics — dashboards that allow drilling into business areas, tracking performance against goals, and identifying red flags.
- Data Analysts require deep, granular access to data — tables, filters, raw figures, anomaly detection tools, and the ability to model or test hypotheses.
Current BI tools struggle to serve these three personas in harmony.
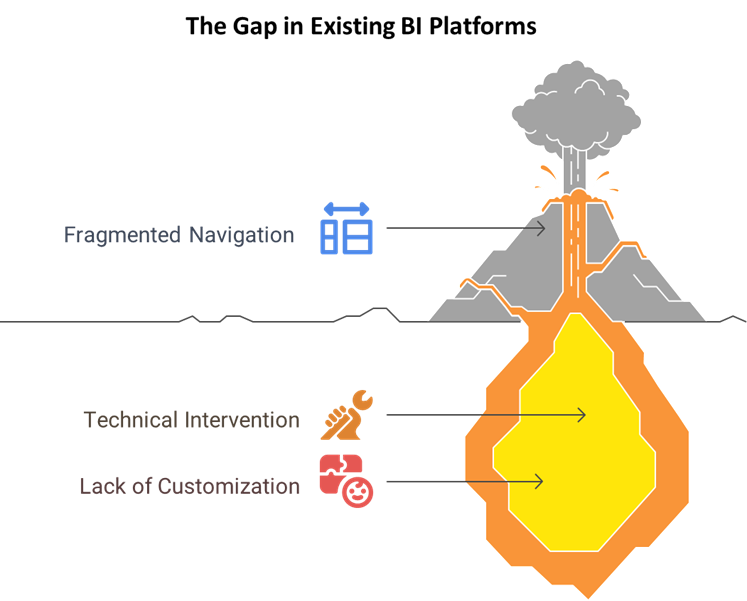
The Gap in Existing BI Platforms
While platforms like Power BI and Tableau offer great visual capabilities, they often fall short in flexibly accommodating varying levels of data granularity and interactivity for different users:
- 01They lack custom contextual experiences — for example, a COO doesn’t need the same visualizations as a Senior Data Analyst.
- 02Most platforms require technical intervention for changes in views or logic, which limits dynamic usage by business teams.
- 03Navigation across dashboards is often fragmented — users need to hop between views or tabs, leading to siloed insights.
This results in multiple dashboards being created for the same dataset — leading to duplication, inconsistencies, and decision fatigue.
Enter GRPS Lab's VisualInsights : The Custom Dashboard Experts
At GRPS Lab, we identified this gap early and addressed it through our VisualInsights vertical — a custom dashboarding approach designed to unify the needs of all key stakeholders into one streamlined solution: the Multi-Versatile Dashboard. This capability is built on seven years of global experience delivering dashboard solutions across diverse client RFPs.
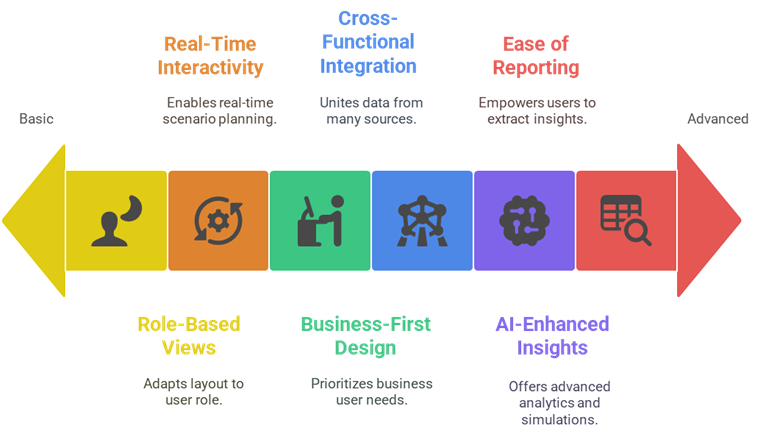
What Sets VisualInsights Dashboards Apart?
- 01Role-Based Views:
- 02Real-Time Interactivity:
- 03Business-First Design:
- 04Cross-Functional Integration:
- 05AI-Enhanced Insights:
- 06Ease of Reporting data:
A single dashboard that adapts its layout and depth based on the user’s role. Executives see KPIs, analysts see drill-downs — all from the same source.
Dashboards are equipped with smart toggles, filters, simulations, and what-if analysis tools, allowing real-time scenario planning.
Our Dashboard solutions are built considering detailed requirements for business users, not just data experts — clean interfaces, intuitive navigation, and contextual storytelling.
We bring together data from multiple sources which are stitched meaningfully — giving decision-makers a truly holistic view. At the same time our dashboard can be integrated with multiple value-add features such as cross-tab, custom filter, storyteller, personal workspace etc.
GRPS Lab VisualInsights dashboards include in-depth analytics, simulations, anomaly detection, and pattern recognition built right into the user interface.
A dashboard shouldn't just display data - it should empower users to extract insights, edit visualized charts, and build custom story reports. Our dashboards let users create or download editable, templated PPT reports with specific data cuts, enabling smarter decisions and seamless information sharing.
A Strategic Asset, Not Just a Reporting Tool
When designed right, a dashboard becomes a strategic asset. It empowers:
- Executives to steer business with confidence.
- Decision-makers to identify levers of growth and risk in real-time.
- Analysts to deep dive into questions without waiting on IT or data teams.
This is the future of dashboarding. And this is where GRPS Lab's VisualInsights stands out — not as a reseller of generic BI tools, but as a partner in building intelligence systems tailored for real-world complexity.
Moving Beyond One-Size-Fits-All Dashboards
BI tools will always be foundational. But when it comes to driving real decisions across an organization, you need more than just static visuals — you need a Multi-Versatile Dashboard.
At GRPS Lab, we don't just build dashboards. We build clarity, alignment, and decision-making velocity. For more information write to us at info@grpslab.com or gururaj.kulkarni@grpslab.com
Let’s transform the way your team sees and uses data.